Start Somewhere With Web Analytics
 Do you know how many hits your Web site gets? Is this question something you even think about?
There are a lot of moving parts to a Web site, from technology to content to usability to whether or not the Web site is even up and running. Even if you are working with a trusted partner such as Dunkirk Systems, LLC, for the business owner or stakeholder it can be overwhelming the amount you need to be cognizant of with regards to your Web site.
One aspect of a Web site commonly placed lower on the priority list is Web analytics, or the review and analysis of traffic to your Web site. Analytics involves the number of hits on Web pages, the cluster of those hits called a visit, whether the visit is new or returning, when and how long the visitor was at your Web site, how they navigated the Web site, how did they come about your Web site and with what computer and browser.
If the preceding paragraph did not overwhelm you, congratulations! The above is a lot to digest, but you realized its importance. If you previously had not thought much about analytics, you may be wondering where to start.
My recommendation on Web analytics is to start on a basic level. First, reacquaint yourself with your system for viewing and analyzing this information. It may be available from a number of sources. Most all Web hosting companies offer some form of analytics, from raw Web log files (where hits to your Web site are recorded) to a Web-based interface to review the information captured in these files. Even if you Web host offers this, you may have available to you services for analysis, such as Google Analytics, which are third-party services that collect Web hit information based on a small piece of code added to each Web page that is not viewable to the Web user.
Now that you have your Web analytics software in front of you, take a look at the basic or “dashboard” information. This is typically what you see when you first log into the analytics Web site. Now peruse through this information. Take a look at the various reports, whether in tables or graphs, and familiarize yourself with what is presented. At first it may not mean much. However over time and repeated review of this information, you will get a feel for how people use your Web site.
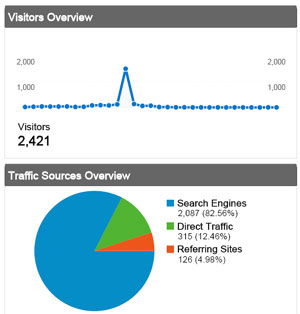
The accompanying graphic with this post is an example of part of a dashboard report for a real Web site I manage and whose name I am purposely not stating at this time. Note there is a huge spike in traffic in the reporting period. I show this example as you may have similar occurrences with your own Web site, and with a better understanding of your analytics, you’ll be able to better understand why this happened, as I did with this Web site.
Continued review of your Web analytics will help you recognize the utilization of your Web site, understand the effectiveness of content and information presented on it and guide you in decision making in how you update and change your Web site. This task also has some complexity to it, but it is helped by understanding the numbers. And to do so, you need to start somewhere.
Business • Technology • (0) Comments • Permalink
